

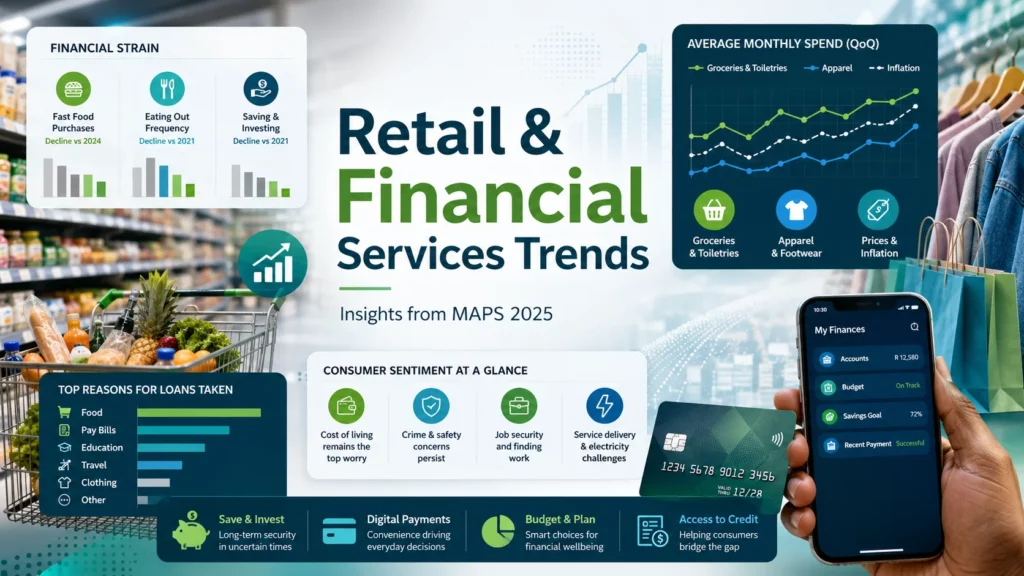
South African consumers are not simply spending less or more. They are reallocating money, attention, trips, risk and loyalty in response to financial pressure, digital access and changing household priorities.
The April 2026 launch of the 2025 Marketing All Products Survey (MAPS), covering results from January 2021 to December 2025, shows a market shaped by pressure but not paralysis. Consumers still buy groceries, clothing, airtime, fast food and financial products, but they now make sharper choices about frequency, channel, outlet and value.
For retailers, banks, insurers and shopping-centre owners, the message is clear: growth will not come from broad averages alone. It will come from knowing which consumers are under pressure, which categories remain resilient, and where demand concentrates at neighbourhood level.
Key takeaways
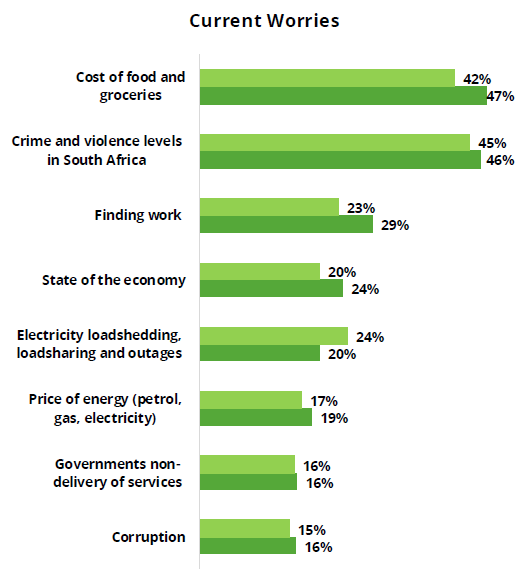
- South African consumers are prioritising essentials, with food and groceries remaining the biggest worry for 47% of respondents in 2025.
- Loans are increasingly linked to survival needs: food rose from 34% of loan reasons in 2023 to 38% in 2025.
- Grocery spending remains resilient, with average monthly grocery-only spend reported at R2,169 in 2025.
- E-commerce has become a meaningful but selective channel, with 18% past-four-weeks penetration and strong use for airtime/data, clothing and food/drink.
- Spatialising MAPS turns national survey insight into neighbourhood-level strategy by showing where consumers live, shop, bank and respond to offers.
1. The consumer economy has moved from recovery to resilience
The MAPS data shows a consumer market still carrying the effects of several years of inflation, unemployment and income pressure. In 2025, 47% of respondents identified the cost of food and groceries as a current worry, slightly above the 42% recorded in 2024.
This matters because grocery anxiety sits at the centre of retail and financial behaviour. When households worry about food, they do not only change what they buy; they also change when they buy, where they shop, whether they borrow, and which brands they trust.
The broader inflation environment provides important context. Statistics South Africa’s December 2025 CPI data, as reported by NAMC, showed headline inflation at 3.6%, while food and non-alcoholic beverages inflation remained at 4.4%.
2. Retail is being driven by essentials, convenience and channel switching
The strongest retail signal in the survey results is the continued dominance of essential categories. Groceries, toiletries and household basics remain the anchor of consumer expenditure, even while discretionary categories such as apparel show more volatility.
MAPS reports average grocery-only spend at R2,169 in 2025, while 45% of respondents say they usually do the grocery shopping themselves. This confirms that grocery purchasing remains both a high-value and high-control household decision.
Retailers should read this as a signal of purposeful shopping. Consumers are not drifting through stores; they are managing budgets, comparing options and choosing outlets that help them stretch income.
3. Grocery shopping is frequent, planned and value-led
The grocery behaviour data shows a strong monthly pattern, with 62% of respondents using delivery services on a monthly basis. This suggests that many households anchor their grocery cycle around payday or monthly income flows, then supplement with smaller top-up trips.
This creates two distinct retail opportunities. Large-format retailers and supermarkets capture the planned monthly basket, while convenience stores, spaza shops and neighbourhood outlets compete for top-up missions.
The top-retailer patterns reinforce this split. In-store bulk shopping, day-to-day groceries, convenience shopping and toiletries each show different outlet choices, with spaza shops remaining visible in day-to-day and convenience behaviour.

4. E-commerce is growing, but it is not replacing the store
E-commerce has become a real part of the South African retail landscape, but the MAPS data shows selective adoption rather than a full migration online. The 2025 MAPS webinar reports 18% e-commerce penetration in the past four weeks.
The top online shopping categories show why this matters. Communications, cellphones and prepaid services lead the online category list, followed by clothing and food/drink.
This means digital retail growth is strongest where the online channel solves a clear problem – speed, replenishment, access, delivery or convenience. Retailers should therefore integrate online and physical channels around specific shopping missions, not assume that all categories will move online equally.
5. Clothing has become a hybrid retail category
Clothing remains one of the most important categories for understanding consumer confidence. The MAPS online shopping data shows that, among those who bought online in the past four weeks, clothing accounted for 35%, followed by fast food at 21%, groceries at 16%, footwear at 11% and tech/appliances at 9%.
This points to a hybrid apparel market. Consumers still want stores for fit, immediacy and browsing, but they increasingly use online channels for comparison, promotions and convenience.
Retailers should see apparel as both a traffic driver and a digital conversion category. Shopping centres and brands that connect store visibility, online discovery and targeted promotions will stand a better chance of capturing value-conscious shoppers.
6. Fast food is under pressure but still strategically important
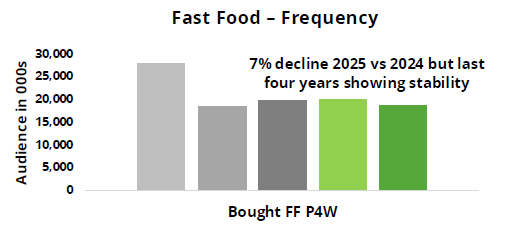
The financial strain section shows that fast-food frequency declined by 7% in 2025 versus 2024, although the last four years show more stability. Eating out declined more sharply, with weekly eating out down 12% and monthly eating out down 58% compared with 2021.
This does not mean that fast food has lost relevance. It means consumers are more selective and need a stronger value proposition before they spend.
The decision factors support this interpretation. Good quality food, portion size, convenient location and good value all rank as important reasons for choosing a fast-food outlet.
7. Financial services are becoming a survival infrastructure
The most important financial-services trend is not only banking penetration. It is the way financial products now support household survival, transfers, risk management and informal savings.
MAPS reports that 77% of respondents have a bank account excluding SASSA accounts. It also reports that 20% transfer or send money to family or friends monthly, with an average amount of R1,097 sent.
This shows that money movement is not just transactional. It reflects household networks, dependants, migration, family support and informal resilience.
8. Borrowing is increasingly linked to basic needs
The clearest warning sign is the loan data. MAPS shows a 58% increase in people taking out a loan in the past 12 months in 2025 versus 2024.
The reasons for loans show the depth of household pressure. In 2025, food accounted for 38% of loan reasons, followed by paying bills at 14%, travel at 11%, education at 8%, clothing at 5% and other at 5%.
This creates a difficult but important challenge for financial-services providers. Credit products must address real liquidity needs without deepening consumer vulnerability.
9. Saving and investing are losing ground
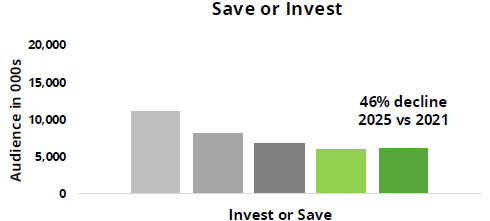
MAPS reports a 46% decline in saving or investing in 2025 compared with 2021.
This trend matters because it points to shrinking financial buffers. When households save less, they become more exposed to food-price shocks, transport costs, school expenses, medical events and income interruptions.
Banks, insurers and asset managers should not respond only with traditional savings messaging. They need practical, low-barrier products that help consumers build emergency buffers, automate small contributions and protect against everyday shocks.
10. Insurance is broad, but cover remains uneven
The financial-services section reports that 37% of the population has insurance in some form. Funeral insurance or policies reach 32%, while short-term insurance is only 2%.
This pattern reflects the real hierarchy of risk in many households. Funeral cover protects families against culturally and financially significant events, while short-term insurance remains less accessible or less relevant to many consumers.
Medical aid also remains highly segmented. MAPS reports that 59% of respondents with medical aid cover are the main members, while the area distribution shows stronger metro representation for medical aid and short-term insurance cover.
11. Stokvels and remittances remain central to financial behaviour
The MAPS data shows that 7.8% of respondents belong to a stokvel, with a stronger rural distribution than the total population profile.
This is a strategic insight for banks and insurers. Informal financial networks are not marginal; they are part of how households manage uncertainty, savings, social obligations and collective support.
Financial-service providers should design around these behaviours rather than ignore them. Group-based savings, transparent rules, low-fee transfers and community-linked insurance can convert informal trust into formal value.
12. Retail and finance are converging around the same consumer
Retailers and financial-service providers increasingly serve the same need state: helping households manage constrained cash flow. A grocery basket, a store-account decision, a loan, a money transfer and a funeral policy all sit inside the same household budget.
This creates opportunities for partnerships. Retail loyalty programmes, embedded finance, grocery-linked rewards, low-cost insurance and airtime/data bundles can become powerful tools when they solve real household problems.
External retail data also supports the view that consumer spending has not disappeared but remains uneven across categories. Reuters reported that South African retail trade sales rose 5.1% year-on-year in April 2025, with general dealers and textiles, clothing, footwear and leather goods among the positive contributors.
13. Spatialising MAPS: from national trends to neighbourhood decisions
The spatialising of MAPS adds the missing strategic layer – place. Standard survey data explains who the consumer is, but MAPS Spatial Intelligence shows where the consumer is at a neighbourhood level, using statistically credible and operationally workable granular data.
This shift matters because retail and financial behaviour are local. National or provincial figures may show that grocery spend is resilient, but spatialised MAPS can show which neighbourhoods or shopping malls support bulk shopping, which areas depend on spaza and convenience trips, and where financially stretched households may need lower-cost banking, credit or insurance products.
GeoScope’s GeoMAPS product turns MAPS from a static dataset into a spatial decision platform. GeoScope uses small-area estimation to provide a single decision framework that supports hyper-local targeting, store planning, catchment analysis and neighbourhood-level market strategy.
Read more about how retailers can define their outlet trade areas and integrate GeoMAPS data to define their market potential and to benchmarks store performance
FAQ
What is the most important retail trend in the MAPS 2025 data?
The most important retail trend is the shift toward essential, value-led and mission-based shopping. Grocery spend remains resilient, but consumers manage it carefully through monthly bulk trips and smaller fill-up purchases. This creates different roles for supermarkets, discount retailers, spaza shops, convenience stores and shopping centres. Retailers that understand the shopping mission behind each trip can position the right formats, promotions and tenant mixes more effectively.
What does the loan data reveal about South African households?
The loan data suggests that borrowing has become more closely linked to household survival. Food was the leading reason for loans in 2025, rising to 38% of loan reasons, while paying bills accounted for 14%. This points to liquidity pressure rather than purely aspirational borrowing. Financial institutions should treat this as a signal to design responsible, transparent and lower-risk products that help consumers bridge short-term needs without creating long-term debt stress.
Is e-commerce replacing physical retail in South Africa?
No. The MAPS data suggests that e-commerce is growing selectively rather than replacing stores. Online activity is strongest in categories where digital access solves a clear problem, such as airtime/data, clothing discovery, food delivery or convenience purchases. Physical stores still matter for groceries, bulk shopping, personal service, immediate fulfilment and trust. The stronger strategy is therefore omnichannel: connect digital discovery with local store presence and targeted neighbourhood demand.
Why does spatialising MAPS matter for retailers and financial-services companies?
Spatialising MAPS matters because national averages hide local opportunity. A bank, insurer, retailer or shopping centre needs to know where specific behaviours concentrate, not only how common they are nationally. GeoMAPS can translate survey findings into neighbourhood-level profiles, helping decision-makers identify catchments with strong grocery demand, financial strain, online adoption, insurance gaps or specific shopper segments. This turns consumer insight into practical decisions about location, targeting, product design and investment.
To download the MAPS 2025 presentation Click Here
