

South Africa’s clothing, grocery and broader retail sector faces a difficult contradiction. Consumers still need food, clothing and household products, yet weak income growth, high living costs and economic uncertainty are forcing households to reconsider where, when and how much they buy.
The pressure has become particularly visible in clothing retail. Gareth Edwards and Francis Herd on eNCA Number of the Day highlight that The Foschini Group, owner of brands such as Foschini, Markham, Totalsports, Sportscene and Sneaker Factory, lost approximately R24 billion in market value over the preceding year, with its share price falling to levels last seen in 2010. The fall reflects more than investor sentiment – it points to fundamental changes in macroeconomic conditions, consumer demand, competition, operating costs and retail location performance.
In these macroeconomic conditions, clothing brands should strengthen the performance of their existing store portfolios by reducing operating costs, improving the replenishment of core and seasonal stock, maintaining stable pricing on value items, sourcing locally where viable, and minimising markdown-related losses. Store rationalisation should be undertaken selectively and sequentially, closing or repositioning underperforming stores while minimising disruption to customers and preserving the overall efficiency of the network. Brands should concentrate on value-oriented markets while pursuing selective expansion in locations with stronger growth potential.
Omnichannel integration should become a strategic priority, using established store networks to support fulfilment, collection, returns and exchanges. This approach strengthens the connection between the consumer and the brand, improves convenience and creates more opportunities for repeat purchases and additional sales.
These difficulties being experienced by TFG and other clothing brands do not mean that South Africans have stopped buying clothes. It indicates that retailers can no longer rely on national averages, established brand recognition or broad demographic categories to explain purchasing behaviour. Retailers increasingly need detailed evidence showing who still buys, what they buy, what they can afford and where those consumers live.
Key takeaways
- South African retailers face weaker discretionary spending, aggressive online competition and rising pressure on store profitability.
- Clothing expenditure has recovered from recent lows, but purchasing frequency remains volatile and below earlier levels, with trends heading towards negative territory.
- Different household life stages show markedly different spending patterns and market opportunities.
- MAPS provides nationally representative evidence on consumer behaviour, expenditure, brands and media use.
- GeoMAPS converts that evidence into neighbourhood-level intelligence for retail planning and marketing.
The R24 Billion Warning for Clothing Retailers
TFG’s market decline provides a powerful warning not only because it affects one of South Africa’s largest and most diversified fashion businesses, but also because it signals a broader risk to other clothing brands and the retail sector as a whole. The group now has a portfolio of approximately 40 fashion and lifestyle retail brands, meaning weaker performance can affect multiple market segments, from women’s fashion and menswear to footwear, jewellery and sportswear.
The company’s challenges also extend beyond its share price. TFG reported a 33.5% decline in full-year profit and identified about 300 underperforming or loss-making stores, with plans to close more than 100 during 2027. Store rationalisation should be undertaken selectively and sequentially, closing or repositioning underperforming stores while minimising disruption to customers and preserving the overall efficiency of the network. TFG’s management attributed the pressure to weak consumer demand, business complexity and the need to reduce operating costs. The full context appears in Reuters analysis of TFG’s store closures and cost reductions.
These figures show why store count alone no longer represents strength. A large network can become a liability when outlets overlap, rental costs increase, merchandise fails to match local demand, or stores operate in areas where the target market has shifted.
A Wider Problem Across Grocery and General Retail
Clothing retailers feel the greatest pressure because households can postpone replacing shoes, jackets and other discretionary items. Grocery retailers cannot escape the problem – financially constrained consumers switch products, buy smaller quantities, respond more strongly to promotions and move between supermarkets in search of value.
GeoScope’s research using the MAPS consumer data shows that South Africa’s grocery market is shifting towards greater value-consciousness and affordability, with Boxer and Shoprite becoming more closely associated with financially constrained households. Pick n Pay and Checkers are attracting broader, increasingly price-sensitive customer profiles while SPAR retains its neighbourhood-convenience position and Woolworths remains the most distinct premium retailer.
This behaviour places pressure on margins. A store may record stable customer traffic while shoppers reduce basket size, move from premium products to private labels or divide their purchases between formal supermarkets, wholesalers, informal traders and online platforms.
Retailers must therefore distinguish between customer numbers and customer value. A busy store does not necessarily generate an adequate return when its trade area contains consumers with limited purchasing power, low category expenditure or weak brand affinity.
Shein, Temu and the New Competitive Reality
Traditional retailers also face competition from digital platforms that operate with different cost structures, product cycles and marketing models. According to the MAP’s consumer survey of 2025, 35% of consumers purchased clothing online in the past four weeks. Shein and Temu generated approximately R7.3 billion in South African clothing, textile, footwear and leather sales during 2024, capturing a combined 3.6% market share. Their combined share exceeded the 3.4% held by established international chains such as H&M, Zara and Cotton On. More importantly, Shein and Temu captured about 37.1% of the sector’s online market, while Shein alone accounted for roughly 28% of online women’s fashion.
This development changes the basis of competition. Local retailers must compete not only on location, range and price, but also on digital convenience, product variety, personalised communication and the speed with which they identify emerging consumer preferences. Traditional clothing retailers have the opportunity to use their existing stores as an integrated digital sales and fulfilment network, supporting click-and-collect, online returns and exchanges, local order handovers, extended online assortments and targeted digital marketing within each store’s trade area.
What MAPS Shows About Apparel Expenditure
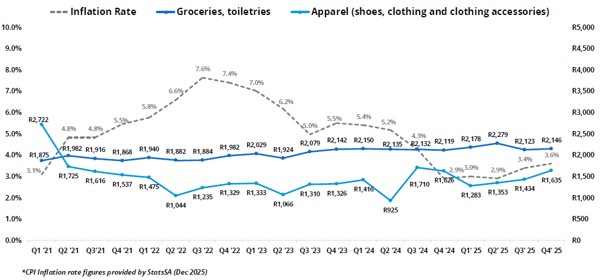
MAPS tracks quarterly average monthly expenditure on apparel, including shoes, clothing and clothing accessories. The data show pronounced volatility rather than consistent growth. Average monthly apparel expenditure declined from R1,875 in the first quarter of 2021 to R1,044 in the second quarter of 2022. It subsequently fluctuated and reached an especially low R925 in the second quarter of 2024, before recovering to R1,635 in the fourth quarter of 2025. Although inflation has contributed to the higher nominal expenditure recorded in the latter periods, it is not simply a consequence of inflation, as the trends indicate that real purchasing frequency, household affordability, seasonal demand, and consumer confidence are also key contributors.
The recovery from the 2024 low is substantial, approximately 77%, but fourth-quarter 2025 spending remained about 13% below the first-quarter 2021 level in nominal terms. Clothing expenditure also moved more erratically than grocery and toiletries expenditure, confirming that consumers adjust apparel purchases more readily when household finances tighten.
Spending Has Increased, but Fewer People Are Buying Frequently
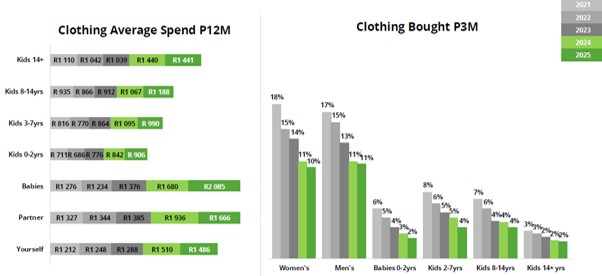
MAPS adds important detail by comparing average annual clothing expenditure with the percentage of consumers who bought clothing during the previous three months.
Annual expenditure on clothing for oneself rose from R1,212 in 2021 to R1,486 in 2025, while spending on a partner increased from R1,327 to R1,666. The strongest increase occurred in the babies category, which climbed from R1,276 to R2,085, reflecting the unavoidable and repeated need to replace clothing as babies grow.
The purchasing-frequency figures tell a different story. The proportion buying women’s clothing during the previous three months fell from 18% in 2021 to 10% in 2025, while men’s clothing declined from 17% to 11%. This suggests that expenditure has become concentrated among fewer purchasers, or that consumers buy less frequently but spend more during each shopping occasion. Potentially a consequence of increasing travel costs to go shopping.
Different Life Stages Require Different Retail Strategies
The life-stage figures show that clothing demand cannot be treated as a single market. Spending on children aged 14 and older rose from R1,110 in 2021 to R1,441 in 2025, while spending on children aged eight to 14 increased from R935 to R1,188.
Spending on children aged three to seven declined from R1,095 in 2024 to R990 in 2025, although it remained above its 2021 level. By comparison, expenditure on babies accelerated sharply, demonstrating that household responsibilities and the age composition of children can predict category demand more effectively than household income alone.
Retailers can explore these differences through consumer segmentation and market analysis. A store surrounded by young families requires a different product mix, price architecture and promotional calendar from a store serving students, young professionals or older households.
What Is MAPS?
The Marketing All Product Survey, or MAPS, is a nationally representative consumer study conducted among South Africans aged 15 and older. Its annual area-based probability sample comprises approximately 20,000 respondents, benchmark-weighted to official population estimates and distributed across provinces, districts and municipalities.
MAPS covers demographics, income, employment, household expenditure, financial behaviour, psychographics, brand loyalty, grocery shopping, clothing, footwear, online activity, media consumption and thousands of individual brands. The main face-to-face questionnaire covers over 5,000 brands, while a leave-behind questionnaire captures additional behavioural and brand information.
This breadth allows retailers to move beyond simplistic descriptions such as “middle-income women aged 25–34.” Through MAPS consumer and brand intelligence, they can examine purchasing frequency, actual category expenditure, preferred stores, product choices, financial behaviour, media exposure and attitudes within the same analytical framework.
Why Geography Completes the Picture
National and provincial findings remain valuable, but retail decisions occur at individual locations. A national average cannot determine whether a particular mall needs another fashion outlet, whether an existing store overlaps with a nearby branch or whether a township contains enough target consumers to support a new format.
GeoMAPS places MAPS consumer information into a geographic context. It uses AI methods, secondary demographic information and machine-learning techniques to produce neighbourhood-level estimates of consumer behaviour and purchasing power.
The resulting intelligence allows analysts to identify geographic concentrations of consumers who resemble a retailer’s best existing customers. It can also show where purchasing potential exists, but supply, accessibility or brand presence remains inadequate.
How GeoMAPS Can Strengthen Clothing Retail Decisions
Successful retail planning requires a balance between four elements:
- the consumer,
- market demand,
- existing supply and
GeoMAPS supports this “diamond of retail optimisation” by combining consumer profiles with expenditure, competitor locations and transport access.
A clothing retailer can use GeoMAPS with retail network planning to evaluate proposed stores, optimise existing networks, identify outlets exposed to cannibalisation and compare actual turnover with estimated local market potential. Marketing teams can also target neighbourhoods with the highest concentration of likely purchasers rather than spreading advertising budgets across broad and poorly differentiated regions.
Access to MAPS and GeoMAPS will not remove South Africa’s economic constraints. It can, however, help retailers respond intelligently by placing the right format, products, price points and messages in areas where consumers have both the willingness and capacity to buy.
Frequently Asked Questions
Why are South African clothing retailers under so much pressure?
Clothing competes with food, transport, electricity, education and debt repayments for a limited household budget. Consumers can delay apparel purchases more easily than grocery purchases, which makes clothing sales sensitive to economic uncertainty and seasonal conditions. Retailers also face aggressive online competition, higher operating expenses, excess store capacity and the cost of maintaining large inventories. TFG’s R24 billion market-value decline illustrates how these factors can affect even a diversified retailer. The underlying problem is not simply that consumers spend less; they shop less frequently, compare prices more actively and distribute their spending across more channels.
What is the difference between MAPS and GeoMAPS?
MAPS is a nationally representative survey that measures consumer demographics, income, expenditure, shopping behaviour, brands, media use and attitudes. It provides national and provincial evidence about what different groups buy and how they make decisions. GeoMAPS adds geographic location by estimating MAPS variables for small geographic areas. In practical terms, MAPS may identify the characteristics of consumers who buy from a particular clothing chain, while GeoMAPS shows where these consumers are concentrated. Retailers can then connect consumer profiles with store locations, competitors, shopping centres, roads and public transport routes.
How can clothing retailers use MAPS and GeoMAPS to improve profitability?
Retailers can use the combined data to estimate local clothing expenditure, identify underserved markets and compare store turnover with the potential demand surrounding each outlet. They can determine whether poor performance results from limited market potential, inappropriate products, excessive competition, weak accessibility or internal store overlap. The data can also guide merchandise allocation, store formats, pricing, media selection and local marketing. Instead of applying one national strategy to every branch, management can tailor each store to the spending power, household composition, clothing preferences and purchasing frequency of its surrounding consumer market.
Can GeoMAPS help retailers decide where to locate or close stores?
GeoMAPS can support expansion, relocation and closure decisions, although management should combine it with store-level financial and operational information. It can estimate the demand accessible to each store, identify overlap between branches and reveal whether customers have shifted to competing centres or retail nodes. A loss-making store in a strong market may require better merchandise, management or marketing rather than closure. It may also mean that nearby brand stores are cannibalising its more optimum location in the market. Conversely, a store with limited surrounding demand, weak access and substantial network overlap may offer little realistic recovery potential. This evidence helps retailers base difficult decisions on market conditions rather than turnover figures alone.
