


Statistics South Africa’s Q2 employment data from the 2026 Quarterly Labour Force Survey (QLFS) exposes structural failures in the country but also exposes the limits of national averages and convenient single-cause narratives.
South Africa’s second-quarter labour force figures are grim. They are also being conscribed into two competing political stories – one blames the government’s lack of reform; the other foregrounds the Middle East war and the fuel-price shock. Each identifies a real pressure. Neither, on its own, is an adequate diagnosis.
The immediate facts
Stats SA reports that the official unemployment rate rose from 32.7% in Q1 2026 to 33.6% in Q2. The broader unemployment measure – unemployment plus the potential labour force – edged up from 43.7% to 43.8%. Employment fell by only 16,000 quarter-on-quarter, to 16.7 million, while unemployment increased by 345,000, to 8.5 million. Year-on-year, employment was down 68,000 and the official rate was 0.4 percentage points higher.
The youth figures remain devastating. Among economically active 15-24-year-olds, unemployment reached 62.8%; for 25-34-year-olds it was 41.8%. Meanwhile, 36.4% of all 15-24-year-olds were not in employment, education or training. These are not normal cyclical blemishes. They show an economy failing to convert a generation’s time and potential into productive activity.

In fact the two major narratives of government policy and the Middle East war, both contribute to the problem.
The first argument focuses on the economy’s long stagnation: weak growth, low fixed investment, unreliable infrastructure and logistics, and an economy that has not created work at anything close to the rate required by population growth. The Q2 industry pattern supports concern about productive capacity. Manufacturing employment was down 100,000 jobs year-on-year; community and social services were down 101,000; utilities were down 36,000. Construction and trade gained jobs, but those gains did not prevent an overall decline.
The Government of National Unity (GNU) should be judged by the results of its reforms, not simply by their announcement. Until these reforms lead to greater investment, stronger productivity, expanded economic opportunities and increased employment, they cannot be considered successful in improving South Africa’s labour market.
But we should not move too quickly from structural diagnosis to ideological certainty. The QLFS does not test whether expropriation law, empowerment rules, climate policy or foreign policy caused this quarter’s employment result. Nor can a single national chart showing the relationship between economic growth and employment determine the contribution of each individual policy. A critical argument is most credible when it acknowledges what the available data can – and cannot – demonstrate.
The second narrative is that geopolitical conflict, fuel-price increases and uncertainty can suppress demand, squeeze margins and delay hiring. The formal sector lost 41,000 jobs in the quarter while the informal sector gained 34,000, a pattern consistent with pressure on formal employment. But “consistent with” is not “caused by”. Stats SA’s survey measures labour-market status; it does not attribute jobs to the Iran war or any other event.
The chronology also demands restraint. South Africa entered Q2 with unemployment above 30% for more than five years, after employment had already fallen by 345,000 in Q1. A shock can aggravate the crisis without explaining it. Making the war the headline cause risks turning a temporary external pressure into an excuse for longstanding domestic incapacity.
There is an additional statistical clue. The official rate rose 0.9 percentage points, but the expanded unemployment rate rose only 0.1 point because the potential labour force fell by 280,000 and discouraged work-seekers fell by 227,000. Some people moved closer to active job search. That is not good news when jobs are scarce, but it shows why a single headline rate can mislead.
The provincial divide is the policy story
The national average conceals different labour markets. Western Cape unemployment was 19.5%; Eastern Cape unemployment was 47.5%. Yet even that contrast needs unpacking. In Q2, Eastern Cape employment rose by 13,000 while its labour force increased by 160,000 and unemployment rose by 147,000. Year-on-year is harsher: employment fell by 116,000, and the unemployment rate jumped by 8%. In the province’s non-metro areas, the official rate reached 56.5% and the absorption rate, the share of working-age people employed, was only 22.4%.
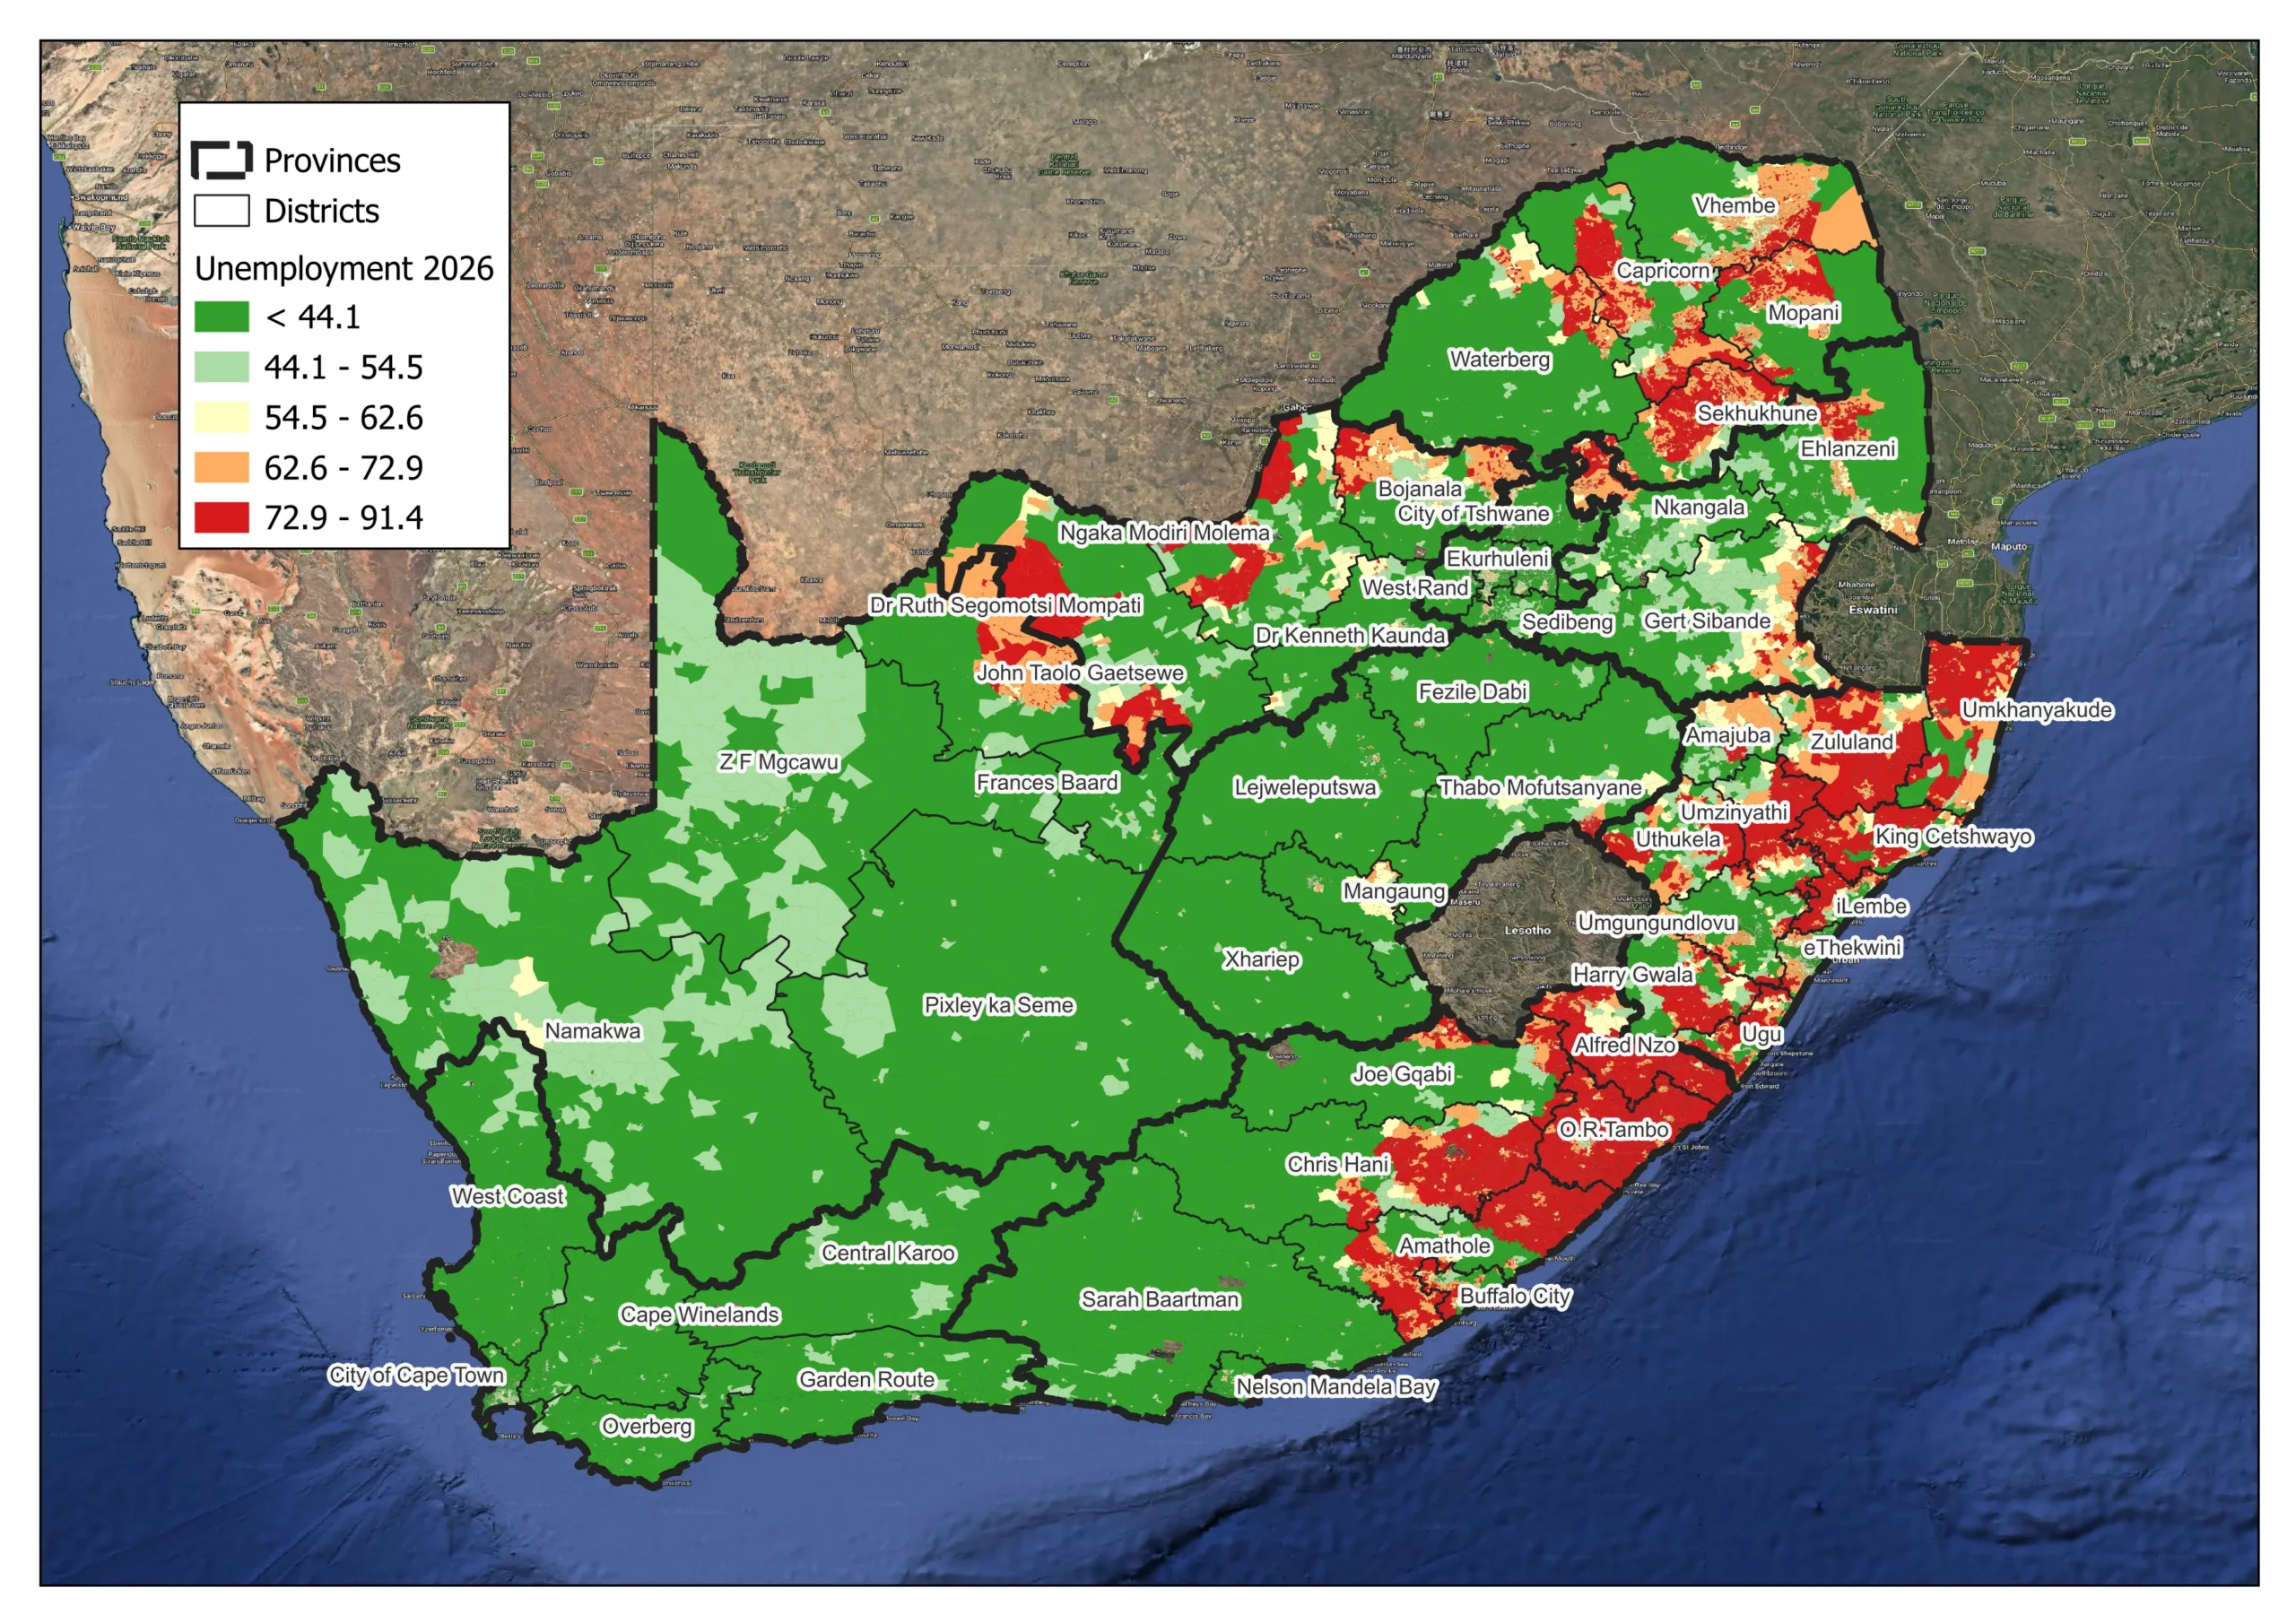
This is why “functional governments creates jobs” is directionally plausible but analytically incomplete. Provincial averages cannot tell a municipality which settlements lack transport access to job nodes, where power constraints block enterprise, where skills and vacancies do not match, or where household demand could sustain a service hub. South Africa’s labour-market crisis has a spatial dimension – many people seeking work live far from the areas where jobs, businesses, infrastructure and growing markets are concentrated. This spatial mismatch limits access to employment and increases the time and cost of finding and travelling to work.
What GeoScope adds – from provincial diagnosis to place-based action
Stats SA provides the authoritative labour-market benchmark, with QLFS designed for provincial and metro/non-metro representation. GeoScope can make that benchmark operational by combining it with detailed, regularly refreshed spatial layers—demographics, age and gender profiles, household income, living-standard measures, township and settlement intelligence, accessibility, infrastructure and business-location data. The map below shows the distribution of the unemployed population in 2020 as a percentage. Clearly indicating how historical, administrative and land capability aspects influence the levels of employment in South Africa. The purpose of the mapping is provide precise data from sample surveys. It is also to use the official estimates as signals to identify the places and mechanisms where policy is needed to influence improved outcomes.
Our solution to the problem has five practical recommended routes:
- Target youth interventions. Map concentrations of young people and Not in Employment, Education or Training (NEET) risk against TVET colleges, schools, digital access, public transport and nearby employment nodes. Training budgets can then follow realistic commuting catchments and sector demand, rather than administrative boundaries.
- Find enterprise-ready locations. Overlay population, income, footfall proxies, land use, electricity capacity, broadband, roads and existing firms to identify township and rural service centres where small-business support, market facilities or industrial infrastructure have the best chance of producing durable activity.
- Repair access to jobs. Model travel time and cost from residential areas to job clusters. In many places, the binding constraint may be transport affordability, route design or last-mile access, not an absence of vacancies across the wider metro.
- Differentiate shocks from structural decline. Track local indicators such as business openings and closures, building activity, freight access, energy interruptions, and household-market change, and compare exposed places with similar, less-exposed places. That creates better evidence about whether a fuel shock, municipal failure or sector downturn is driving the result.
- Make delivery measurable. Build ward- and corridor-level baselines, specify target outcomes and publish dashboards that show whether infrastructure, training and enterprise programmes are reaching intended communities. Spatial monitoring makes it harder for budgets to disappear into averages.
A practical policy architecture would begin with a national spatial labour-market observatory, then require every major employment programme to state four things:
- the exact geography being targeted;
- the constraint being addressed;
- the people and firms expected to benefit; and
- the measurable outcome within a defined period.
QLFS would remain the macro scorecard. GeoScope’s detailed spatial data would guide targeting, prioritisation and monitoring. Administrative and programme data would test delivery.
No more one-number politics
South Africa does not need to choose between blaming domestic policy and recognising global shocks. External conflict can worsen fuel costs and confidence. Domestic policy can depress investment, and the state can fail to deliver the infrastructure firms depend on. Both can be true. The question is which mechanism matters most, where, for whom and over what period.
That is the discipline missing from both narratives. We should not turn a structural crisis into proof of a preferred policy case or risk turning a geopolitical shock into a convenient alibi. The official data supports a sterner conclusion: South Africa’s labour market was profoundly weak before the war, remains spatially fractured, and is not being repaired on the required scale.
The next reform announcement should therefore come with a map. If government cannot show where the unemployed are, where jobs and firms could plausibly grow, which constraint blocks each place, and how results will be measured, it does not yet have an employment strategy. It has a national aspiration floating above a local crisis.
The future has never belonged to those who predicted it most accurately. It has belonged to those who prepared for it best.
Bob Currin is an economist with a long and distinguished record of studying MSMEs and business activity across South Africa, the African continent, and parts of Asia. As the founder and director of AfricaScope and GeoScope, he has spent decades developing advanced survey methodologies, enterprise mapping systems, and geospatial analytics that provide deep insight into the realities of small businesses, informal enterprises, and local economic ecosystems. His work has informed policymakers, international development partners, and private-sector leaders, and continues to shape evidence-based approaches to understanding and strengthening entrepreneurship in emerging markets.
