

When a Safety Net Becomes an Economic Warning Signal
South Africa’s social grant system is often presented as one of the country’s great post-1994 achievements. In one sense, it is. It provides essential support to millions of people who would otherwise face severe hardship. But the General Household Survey 2025 tells a deeper and more uncomfortable story.
By 2025, 40% of individuals and 51% of households benefited from social grants. Grants were also the main source of income for 23% of households, while salaries and wages were the main source for 54%. That means the country is moving dangerously close to a point where the social grant system is not simply supporting the vulnerable, it is carrying the population, which is a consequence of a weak economy.
The most worrying figure is not only that half of households receive grants. It is that in several provinces, grants are more common as a source of household income than salaries. Nationally, 51% of households reported grants as a source of income, compared with 62% reporting salaries. In the Eastern Cape, Limpopo, Free State and North West, grants were more prevalent than salaries as an income source. This is not just a welfare statistic. It is an economic diagnosis.
A healthy economy should be expanding employment, growing small businesses, increasing household earnings and reducing dependence on the state. Instead, South Africa has created a situation where millions of adults and households rely on taxpayer-funded transfers because the economy is not producing enough work, income or opportunity.
From Survival Support to Shared Prosperity
Social grants are necessary. They protect children, the elderly, disabled people and the poorest households. But they cannot be allowed to become a substitute for economic growth. The danger is that grants soften the symptoms of poverty while hiding the cause: too few jobs, too little investment, weak local economies, failing municipalities, poor education outcomes and policy choices that have not unlocked broad-based employment.
This places a heavy burden on taxpayers. A shrinking productive base is expected to fund a growing dependent population. That is not sustainable. No country can grant its way to prosperity. At some point, the economy must create more earners than recipients.
The real question is therefore not whether South Africa should have social grants. It should. The real question is why, after decades of policy promises, so many households still need them to survive. Social grants reveal compassion. But they also reveal failure. They tell us that poverty has not been defeated. Unemployment has not been solved.
Economic policy has not delivered enough dignity through work. South Africa needs a shift from a welfare-centred survival model to an opportunity-centred growth model, one that makes employment, enterprise, skills and investment the primary route out of poverty. Because the true measure of progress is not how many people the state can support. It is how many people no longer need that support.
Mapping Dependency, Revealing Opportunity
This is where GeoScope’s data and mapping capability becomes critical. The GHS tells us what is happening nationally and provincially; GeoScope can help show where it is happening at a far more practical level. By mapping grant dependency, household income sources, poverty indicators, township profiles, service access, retail catchments and local economic activity, GeoScope can turn national statistics into local decision-making intelligence.
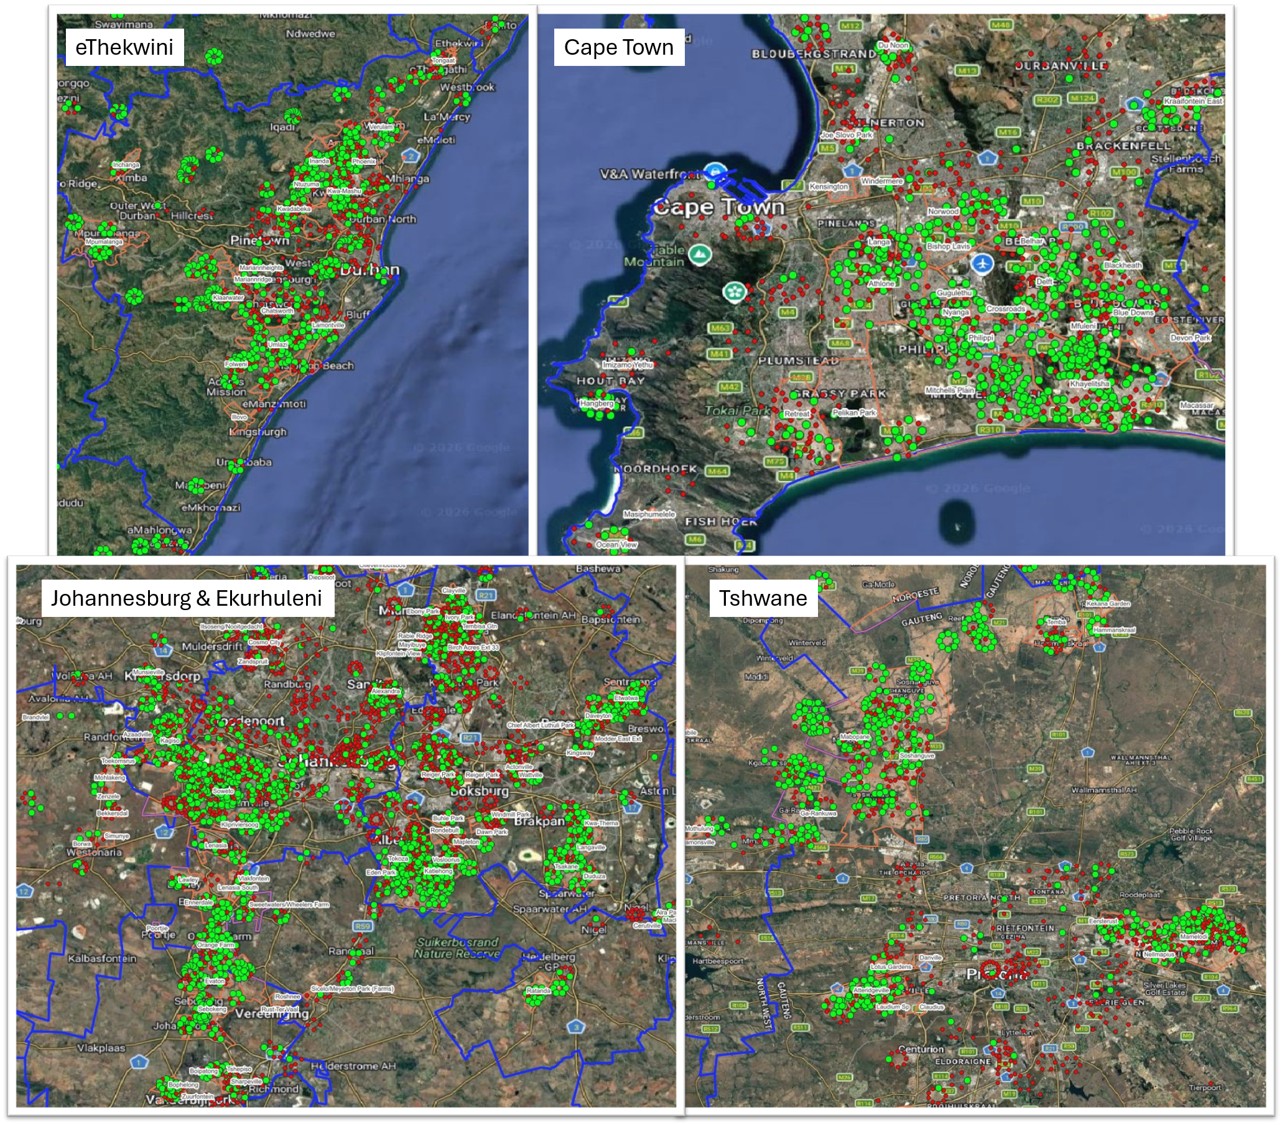
Circle Point Analysis (CPA) converts household survey responses into a spatial picture, showing where randomly selected respondents were interviewed and using colour-coded points to reveal local patterns in social and economic conditions. The uploaded maps show the epicentres of interviews conducted during the General Household Survey, with each point representing a randomly selected respondent. Green points indicate households that access social grants, while red points indicate households that do not access social grants.
Across the metropolitan areas, the maps reveal clear local concentrations of grant-accessing households rather than an even distribution across urban space. In Tshwane, green points reflecting households with access to social grants are strongly clustered in areas such as Soshanguve, Mabopane, Ga-Rankuwa, Mamelodi and Atteridgeville, while more central and suburban parts of Pretoria show a stronger dominance of red points or households without social grants. In Johannesburg and Ekurhuleni, high concentrations of green points are visible in Soweto, Orange Farm, Tembisa, Katlehong, Vosloorus, Tsakane and other township areas, showing the spatial concentration of grant-dependent households around major urban settlements. In Cape Town, green points are most concentrated across the Cape Flats, including areas such as Khayelitsha, Mitchells Plain, Gugulethu, Nyanga, Delft and Blue Downs, while the inner city, Atlantic Seaboard and southern suburbs show greater dominance of hou8seholds without social grants. In eThekwini, green points are strongly clustered in township and peri-urban areas such as KwaMashu, Inanda, Umlazi, Chatsworth, Folweni and surrounding settlements, highlighting how social grant access is closely linked to the geography of poverty, township economies and local household vulnerability.
An analysis of households with social grants shows that the strongest determinant was the number of children under 18 in the household, emphasising that it is households that access cfhild support grants. The presence of adults aged 60 years and older is another important factor, which strongly reflects access to old-age grants. Nationally the analysis of social grants shows that 66% of people receiving a grant is for the child support grant while only 26% is for the old age grant. Other important predictors were not owning a vehicle, lower monthly household income, larger household size, and the number of economically active household members.
The analysis therefore shows that social grant access is most strongly associated with households that include children and older persons, have weaker income and asset positions, and are located in areas where poorer and more vulnerable household structures are concentrated. Overall, the analysis confirms that access to social grants is not random, but closely linked to household dependency structure, limited earnings capacity and economic vulnerability.
For policymakers, this means identifying the communities where grant dependency is highest, where employment creation is most urgent, and where infrastructure, enterprise support and social investment should be prioritised. For companies, it provides a clearer understanding of local consumer realities: where disposable income is constrained, where grant income supports household spending, where township economies remain active, and where products, services, branches or distribution networks should be planned more carefully.
In other words, GeoScope can help move the GHS from a statistical report into a practical map of South Africa’s economic pressure points — showing not only the scale of dependency, but the geography of opportunity.
Bob Currin is an economist with a long and distinguished record of studying MSMEs and business activity across South Africa, the African continent, and parts of Asia. As the founder and director of AfricaScope and GeoScope, he has spent decades developing advanced survey methodologies, enterprise mapping systems, and geospatial analytics that provide deep insight into the realities of small businesses, informal enterprises, and local economic ecosystems. His work has informed policymakers, international development partners, and private-sector leaders, and continues to shape evidence-based approaches to understanding and strengthening entrepreneurship in emerging markets.
